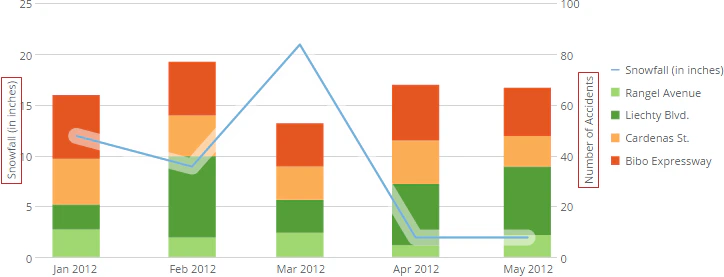
By default, value and category scales in charts do not have titles indi cating what is being measured. Often, scale titles are not necessary because the data or chart title indicates what is being measured. In some charts, scale titles may be necessary to clarify what is being measured, especially in charts with multiple value scales. The following example shows a chart with scale titles:Documentation Index
Fetch the complete documentation index at: https://domoinc-arun-raj-connectors-domo-480626-update-new-field-mi.mintlify.app/llms.txt
Use this file to discover all available pages before exploring further.
- Edit the chart you want, then click Chart Properties.
- (Optional) If you want to add titles to the category scale, click Category Scale.
- (Optional) If you want to add titles to the value scale, click Value Scale. If the chart contains more than one value scale, choose the value scale that corresponds to the element you want to clarify using titles (for example, Value Scale (Bar) in a grouped bar with line chart).
- Enter the desired title in the Title field.
- Click Apply.